Measles in the West Coast
Measles was a disease killing thousands in the 20th century and was considered elimated in 2000. However in the past two years, the number of cases have started to spike. As measles becomes more prevelant, it becomes increasingly important to understand the risks and chances of contact. All of these resources can be explored furthur by clicking on the links, leading directly to the data visualizations. The CDC chloropleth and bar graph are interactive and constantly updated so you can hover on each state and year to explore the data presented to draw your own informative insights. One example being a comparison between the West Coast and the Midwest, which is as follows.
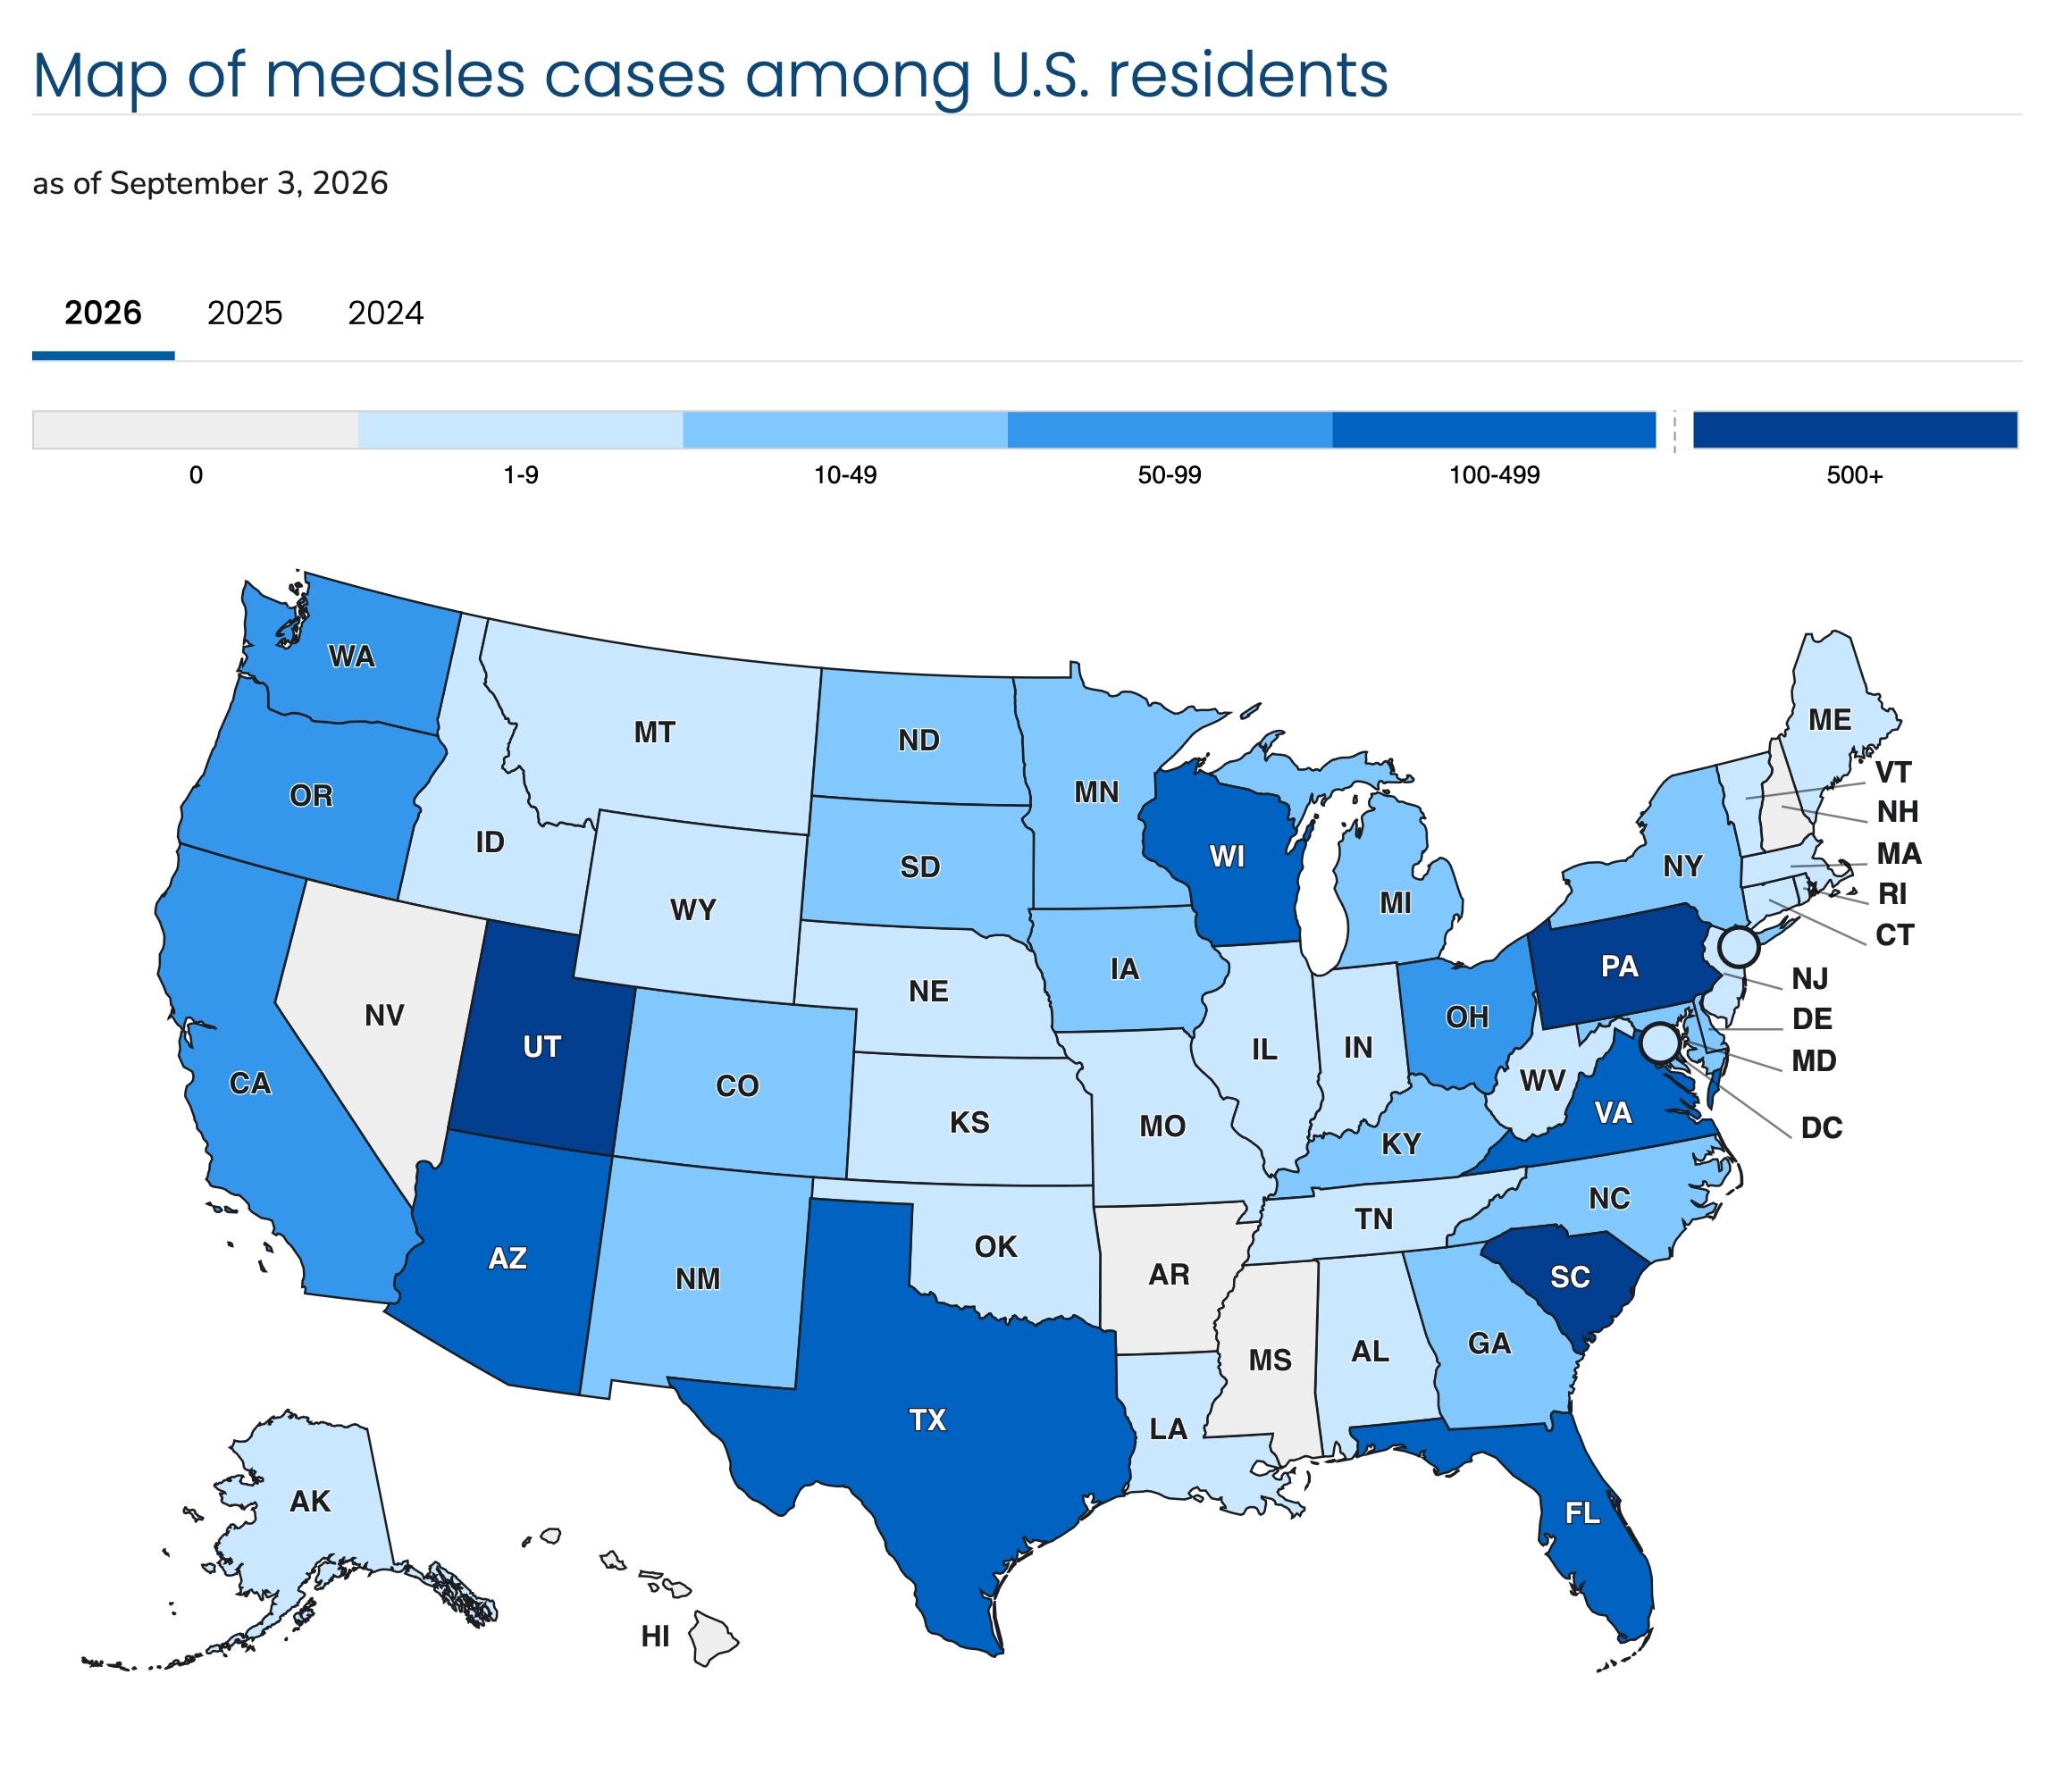
As measles is a national public threat, much of the information comes from the CDC's official website. Since the CDC is the main source, the official page details its history, the number of cases, what you should know about it, public notices, vaccine information, as well as chlorpleths and data charts. The chlorpleths focus on weekly cases, cases across the states, and how vaccinated each state is. The data charts compare the number of cases across years, hospitalizations and deaths. With the rise of measles, there are periodic updates. The chlorpleth on the right details the number of cases per state across three years, with lighter shades of blue signifying less cases and darker shades indicating more cases.
Assuming regional spread for the spike in cases from 2025 to 2026 as shown in Figure 3.2, one can now explore cases by region. The U.S. Census Bureau defines the West Coast as Alaska, California, Oregon, Hawaii, and Washington as seen in Figure 2.2. One insight found was that given this information, the chloropleth shows many of these states as dark blue, meaning a high number of cases. I pulled the number of cases from the csv data table on the website and cross-checked with hovering over the chlorpleth to make sure the numbers for each state matched, and found the West Coast cases totaled 158 cases out of 2777 total cases in the U.S. While the states are dark blue, the West Coast only comprises 0.05% of cases. Comparatively, the Midwest (defined as Illinois, Indiana, Michigan, Ohio, Wisconsin, Iowa, Kansas, Minnesota, Missouri, North dakota, and South dakota) has more states but comprises only 0.08% of cases, which isn't much higher than the West Coast. This shows there isn't a correlation with the number of states and number of cases as previously assumed, raising the question of population density.
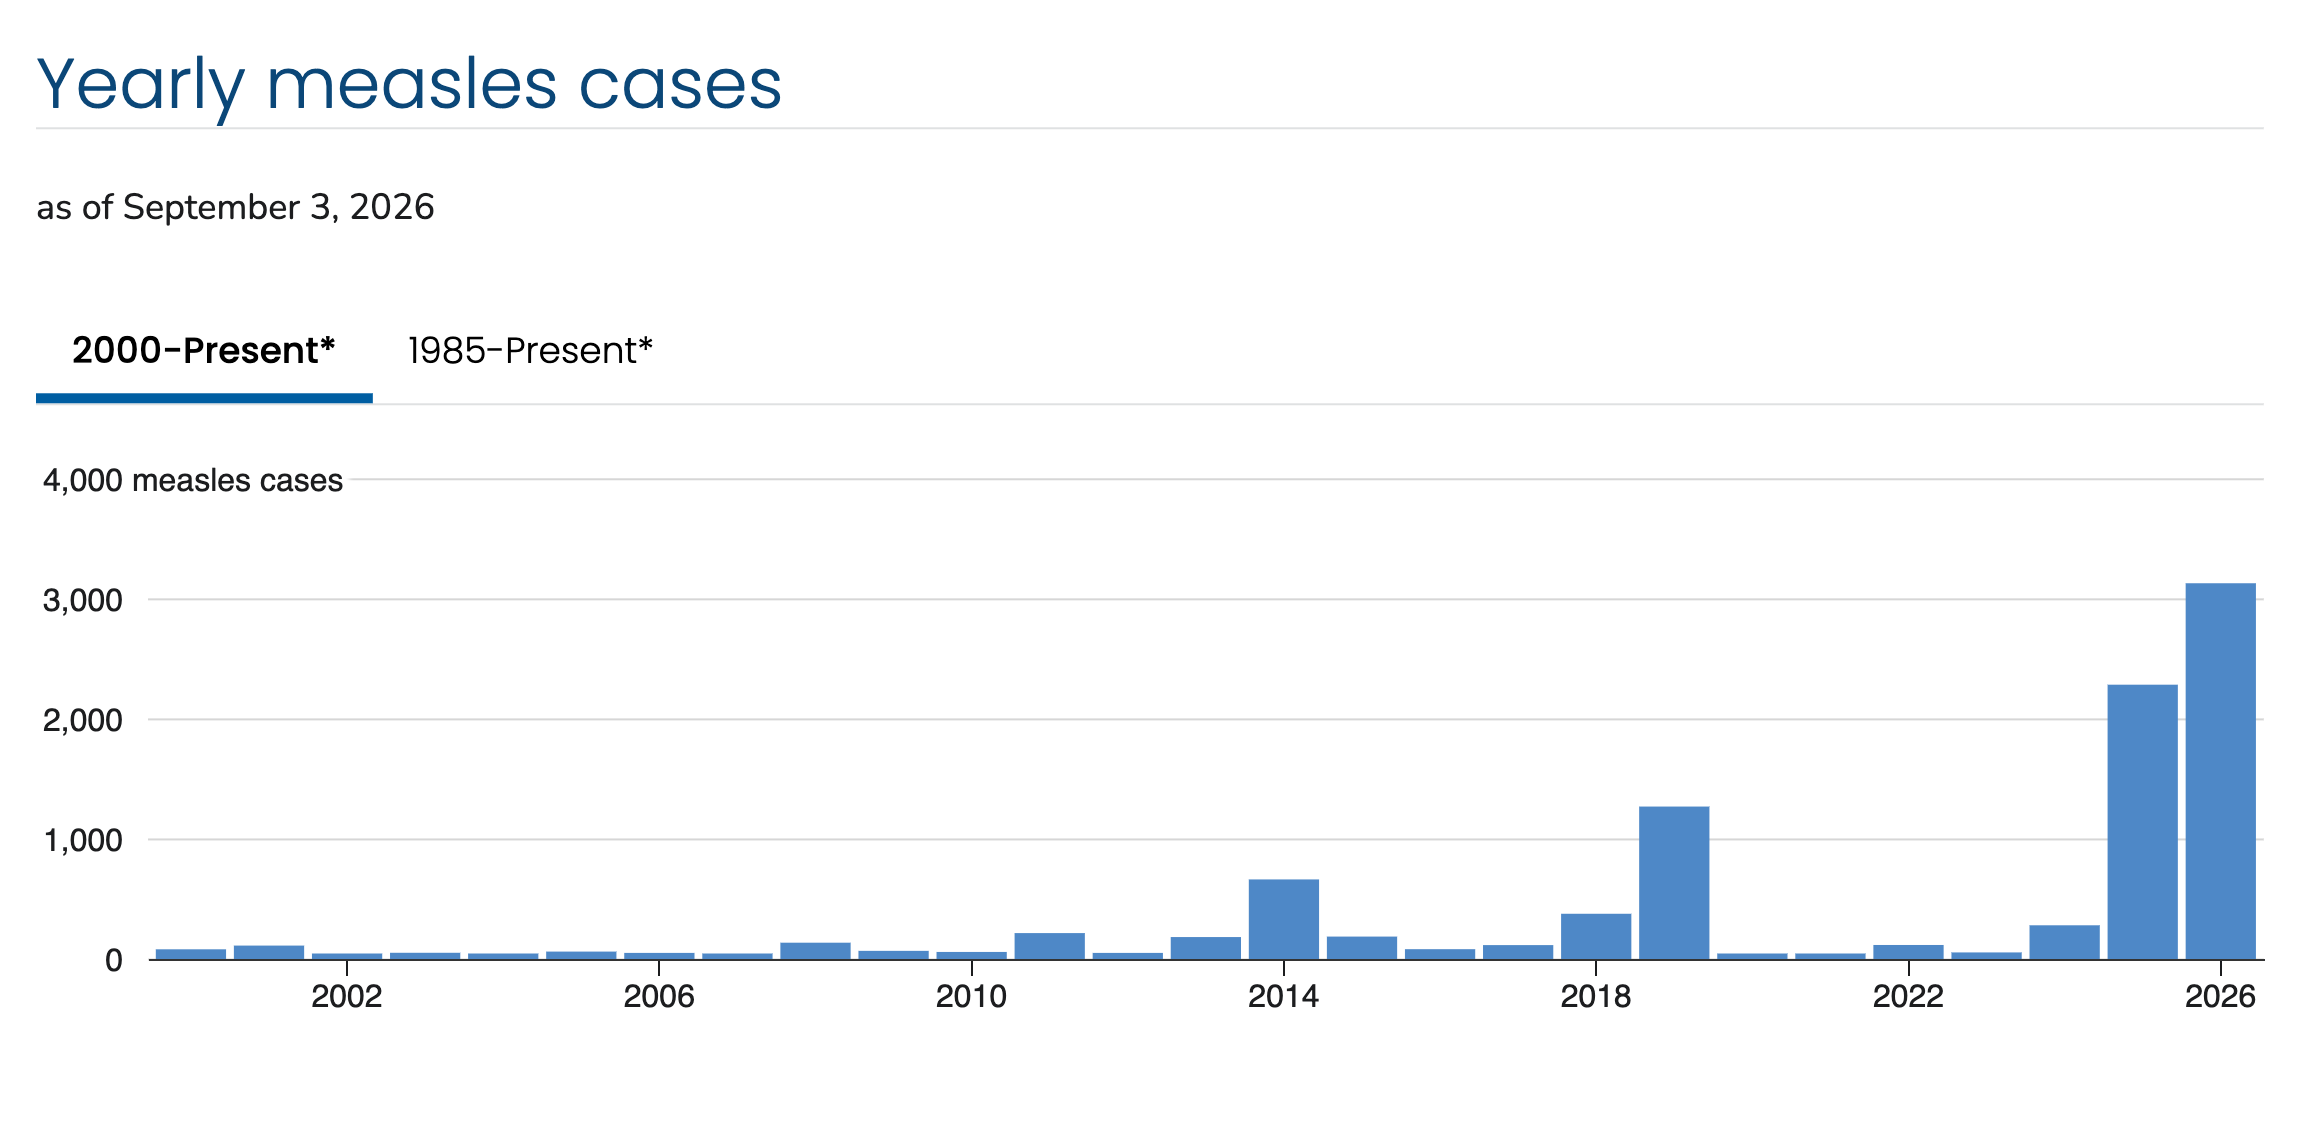
Figure 3.2, a bar graph showing measles yearly cases stretching from 2000, when it was determined elimated to the present as cases skyrocket. CDC Yearly Measles cases
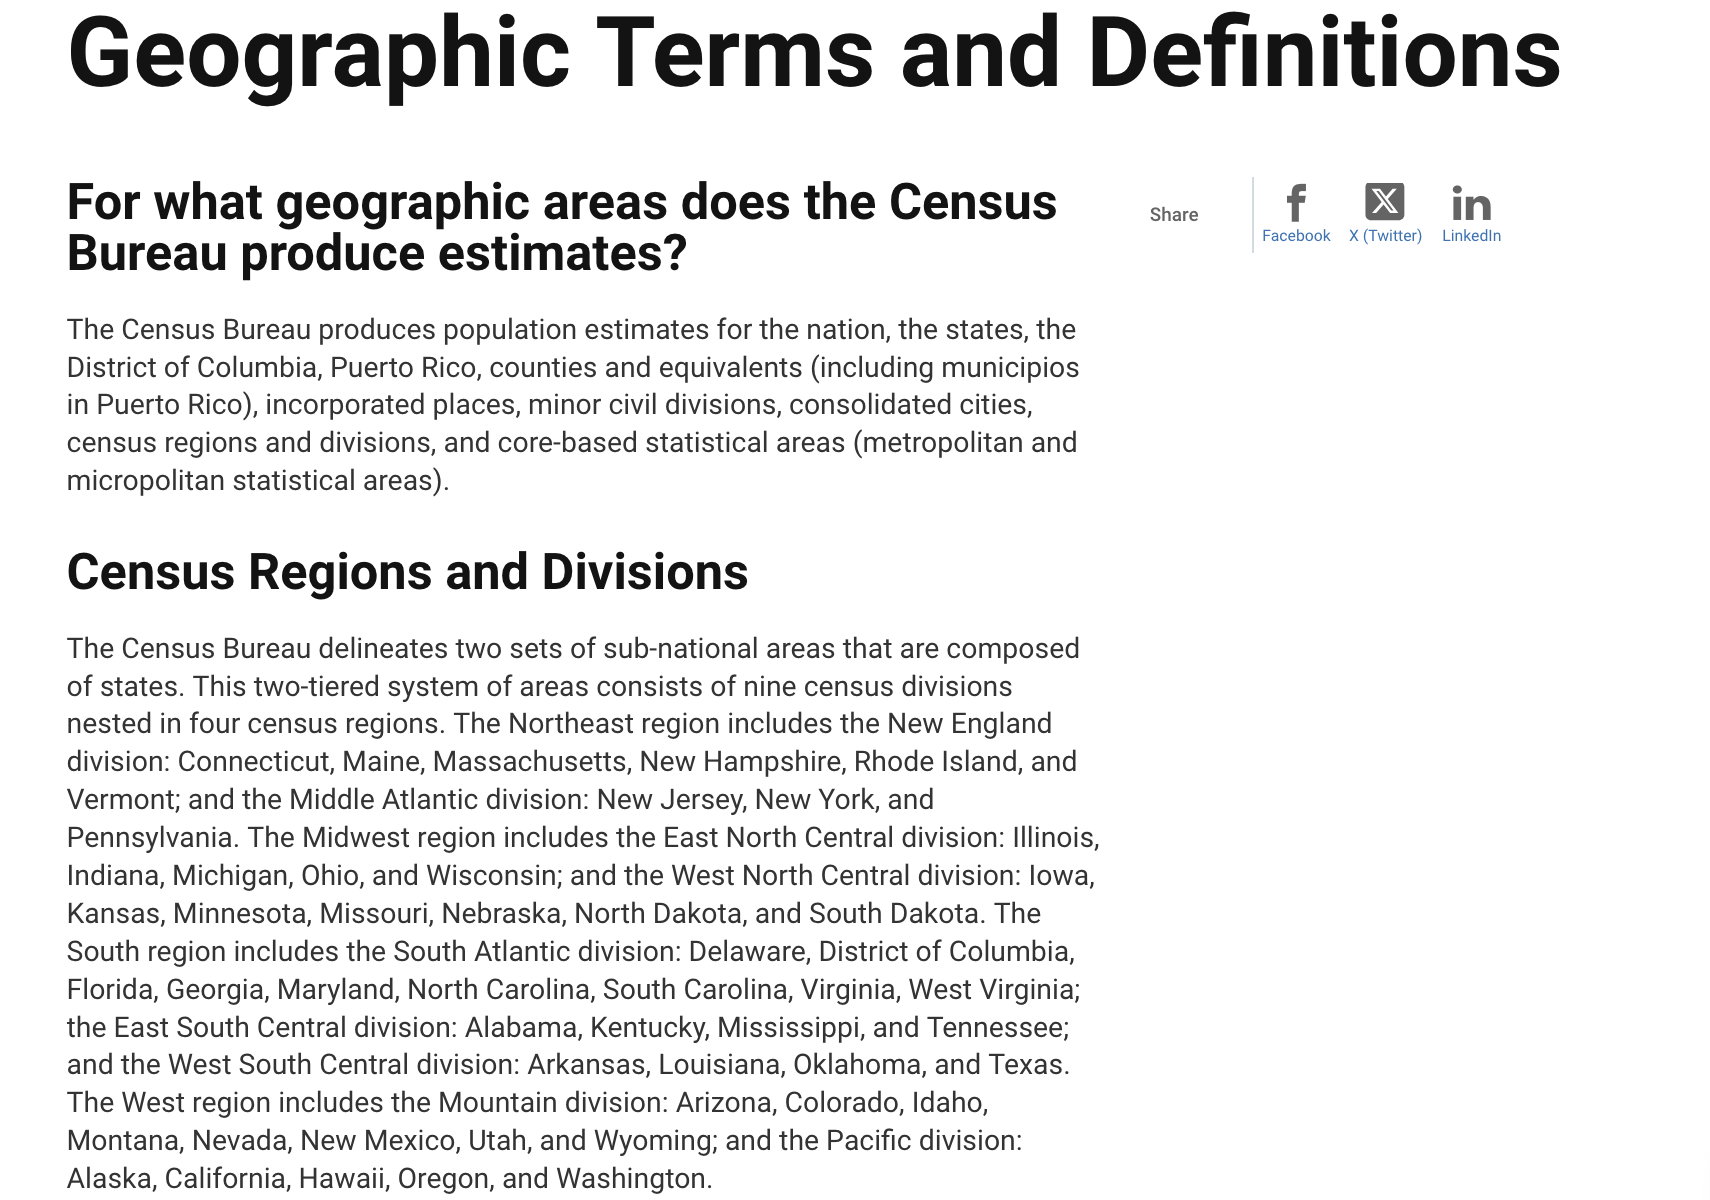
Figure 2.2, screenshot from the U.S. Census Bureau detailing geographical regions and divisions based on census data." U.S. Census Bureau Geographic Terms and Definitions
Unsure of each state's population density, Figure 4.2 lists each state's population density both alphabetically and by size in descneding order. Using this information, it was found that the West Coast states have a higher population density than the Midwest.
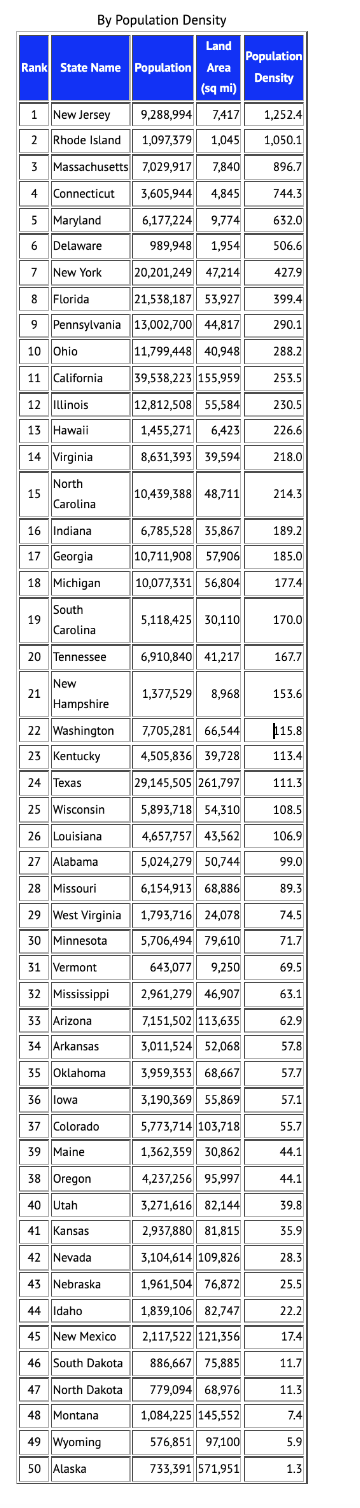
Figure 4.2, a data chart showing U.S. states by population density, where New Jersey has the highest and Alaska has the lowest. .1keydata States by Population Density
What does this mean?
The West Coast has a higher population density overall compared to the Midwest, reflecting the higher number of cases in each state. Since these states are more densely populated, the chacne of measles spreading is higher because you're more likely to be around more people who have also been in contact with someone with measles.
Sources



U.S. BUREAU, Geographic terms and definitions